

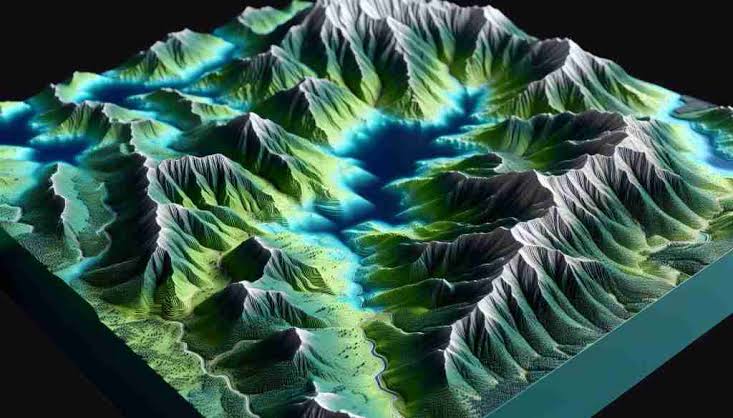
Every civil engineering project, architectural masterplan, municipal infrastructure upgrade, and environmental restoration initiative begins with a fundamental physical question: what does the land actually look like in three dimensions? While a boundary survey establishes legal ownership rights and property limits, a topographic survey captures the physical reality of the terrain itself. It maps the natural configuration of the land—including hills, valleys, ridges, streams, rock outcroppings, and vegetation—along with all man-made structures such as buildings, roads, retaining walls, curbs, and utility infrastructure. Serving as the primary digital canvas upon which engineers and architects design, topographic surveying translates the irregularities of the natural world into precise, actionable spatial data.
The Fundamentals of Relief, Elevation, and Contours
The defining characteristic that separates a topographic survey from a standard 2D planimetric map is the representation of relief—the vertical variations in elevation across the Earth’s surface. Historically and in modern engineering workflows, terrain relief is communicated primarily through contour lines: continuous, imaginary lines drawn on a map that connect points of equal elevation above a recognized vertical datum, such as mean sea level.
Understanding how to read contour patterns is an essential skill for anyone utilizing topographic data:
- Contour Interval: The vertical distance between adjacent contour lines. This interval is chosen based on the project’s scale and terrain steepness—typically 0.25 to 0.5 meters for dense urban engineering sites requiring precise grading, and 1 to 5 meters for large rural infrastructure corridors.
- Slope Steepness and Spacing: Closely spaced contour lines indicate steep slopes that may require retaining walls or specialized earth retention systems, whereas widely spaced contours denote flat or gently rolling terrain ideal for building pads and parking lots.
- Landform Recognition: Concentric closed contours represent isolated hills or depressions (such as sinkholes or retention basins). V-shaped contours pointing uphill signify natural drainage gullies, swales, and stream channels where stormwater collects and flows, while U-shaped contours typically mark broad ridges.
In addition to bare-earth contours, topographic surveyors meticulously record planimetric features—all visible natural and built objects on the surface. Using standardized feature codes in their field data collectors, surveyors log building footprints, finished floor elevations, door thresholds, fence lines, edge-of-asphalt boundaries, sidewalks, utility poles, overhead wire sag points, manhole covers, catch basins, fire hydrants, and individual tree canopy spreads.
Field Data Acquisition Methodologies
Depending on the size of the project area, terrain complexity, vegetation density, and required vertical tolerances, topographic surveyors deploy a complementary suite of advanced technologies:
1. Total Station and GNSS Spot-Height Surveys
On smaller parcels, residential lots, or heavily wooded urban areas where satellite signals are obstructed, field crews collect discrete data points using robotic total stations and GNSS rovers. Rather than measuring arbitrary points, skilled surveyors systematically capture breaklines—linear features where the slope or grade changes abruptly, such as the top and toe of an embankment, the crown and gutter line of a road, or the invert of a drainage ditch. Capturing breaklines accurately is critical because automated surface-modeling software relies on them to render sharp terrain edges realistically rather than artificially smoothing them out.
2. Terrestrial and Mobile LiDAR Scanning
For complex highway interchanges, active industrial plants, dense urban streetscapes, or steep rock cliffs, surveyors deploy laser scanning systems. Terrestrial Laser Scanners (TLS) mounted on tripods emit millions of laser pulses per second to capture 360-degree point clouds of surrounding structures and topography. Mobile LiDAR systems mounted on vehicles scan transportation corridors at highway speeds, capturing every curb, overhead sign, and pavement undulation safely without disrupting traffic flow.
3. Unmanned Aerial Vehicle (UAV) Photogrammetry and Aerial Sensors
Over expansive greenfield sites spanning tens or hundreds of hectares, drones equipped with high-resolution RGB cameras or lightweight LiDAR payloads fly automated grid patterns. When anchored by ground control points measured via RTK-GNSS, drone surveys produce high-resolution orthomosaics and dense digital surface models in a fraction of the time required by traditional ground crews, drastically lowering mobilization costs for large-scale developments.
Digital Terrain Modeling (DTM) and Processing
Once raw field observations are downloaded into specialized surveying software, data points are processed into a Triangulated Irregular Network (TIN). A TIN is a continuous 3D surface composed of contiguous, non-overlapping triangles connecting adjacent elevation points and constrained along surveyed breaklines.
From this TIN surface, software generates two distinct digital models:
- Digital Surface Model (DSM): Represents the top reflective surface of the landscape, including the tops of buildings, tree canopies, and parked vehicles.
- Digital Terrain Model (DTM): A filtered “bare-earth” model from which vegetation and structures have been mathematically removed, leaving only the natural ground topography necessary for earthwork and drainage analysis.
The final deliverable provided to the design team is typically a layered Computer-Aided Design (CAD) file (such as DWG or DXF) paired with an XML surface file and a certified PDF topographic plan. Civil engineers import this 3D surface directly into design software to model building pads, calculate earthwork cut-and-fill balances, design stormwater management ponds, and verify ADA-compliant accessibility slopes.
Key Industry Applications
Topographic surveys underpin decision-making across a diverse spectrum of professional sectors:
- Architectural Site Planning: Architects study slope orientation, adjacent building heights, and tree locations to optimize building placement for solar gain, preserve mature landscaping, and minimize expensive foundation excavation.
- Hydrological and Floodplain Modeling: Hydraulic engineers combine high-resolution topographic surfaces with bathymetric channel data to simulate 100-year storm events, delineate flood insurance boundaries, and design bridge hydraulic openings.
- Mining and Stockpile Inventory: Periodic topographic scans of aggregate quarries, coal piles, and woodchip storage yards allow operators to compute precise volumetric inventories by comparing current TIN surfaces against baseline scans.
- Environmental Restoration: Ecologists rely on micro-topographic surveys with vertical tolerances under two centimeters to design wetland grading where subtle elevation differences dictate water depth and native plant survival.